


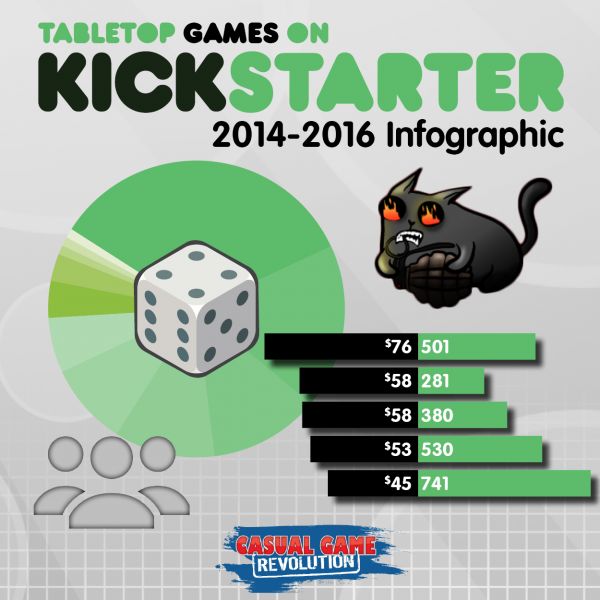
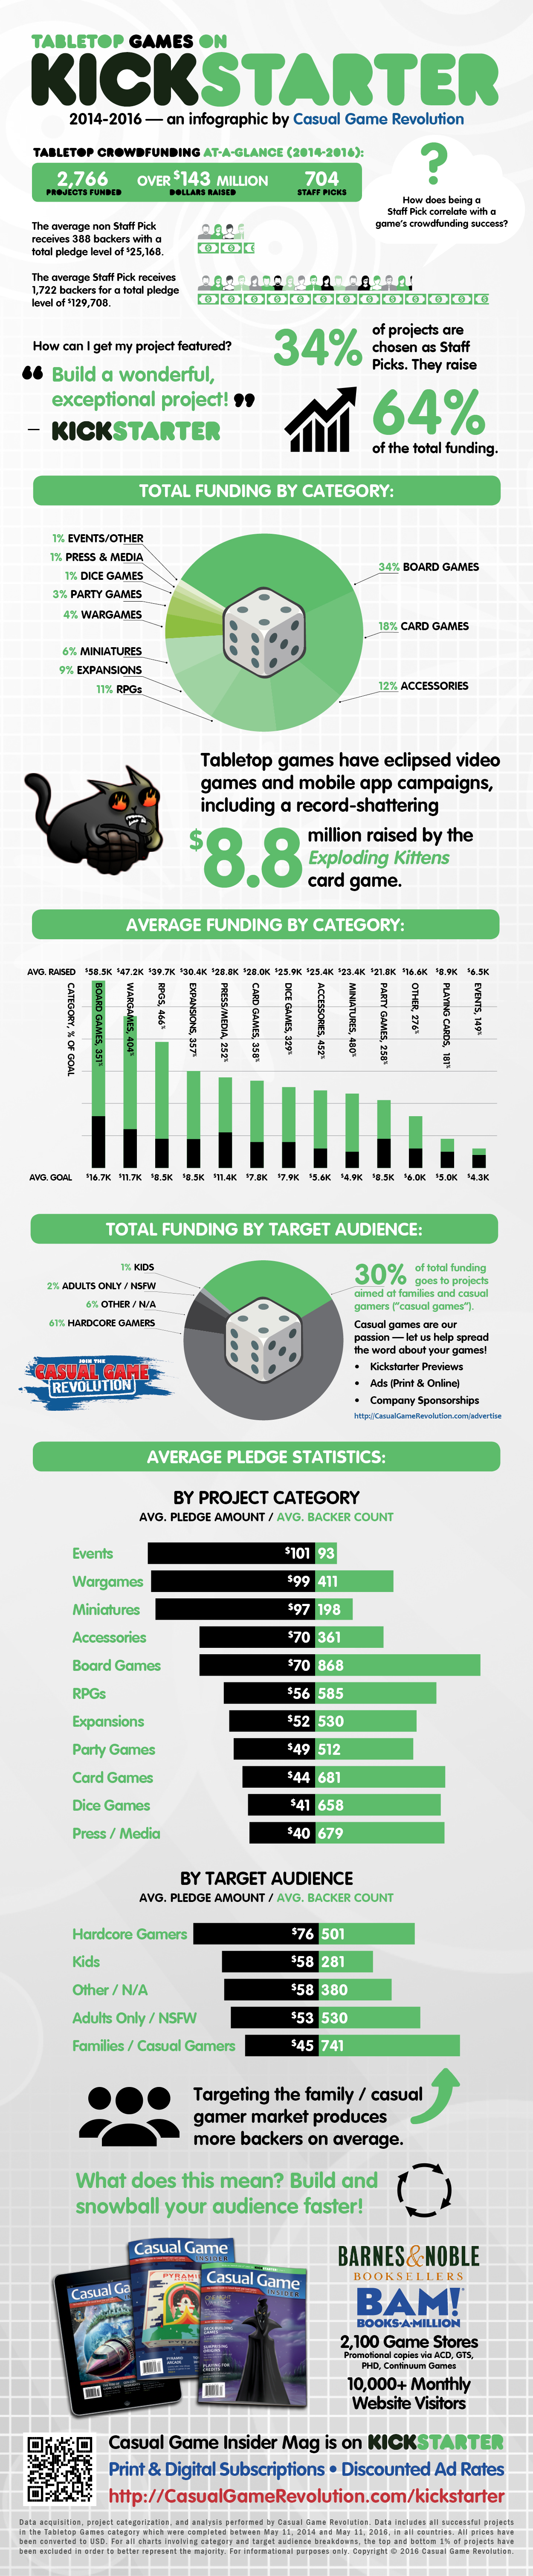
Casual Game Revolution has collected and analyzed two full years of Kickstarter data in the Tabletop Games section (May 2014 through May 2016). What categories of games are the most successful? What is the impact of being designated as a Staff Pick? How much funding should a project owner expect to receive on average? These are all questions we set out to answer.
There is also a printable PDF report available, which provides more detail on this project and its findings. Click here to download.
If you are interested in the nature of the data used for this analysis, including the removal of outliers, please read the fine print at the bottom of the infographic and PDF.
If you own a blog or website that is related to tabletop games, feel free to share this infographic with your audience by copying and pasting the HTML code below (linkback is required).
If you like what we're doing, please consider supporting our Kickstarter campaign and be sure to sign up for our email newsletter. Thanks!
Short link: http://CasualGameRevolution.com/ks-infographic-2016 (Click image to view larger.)


https://www.facebook.com/groups/TabletopKickstarters/permalink/114091322...
You should join the discussion on facebook.
We can't claim that this data is perfect, since there is subjectivity in classifying Kickstarter projects into categories and target audiences. We also didn't have access to data on failed campaigns (we would have very much liked to include them). For anyone who wants to criticize this data and our conclusions, you are welcome to do so. However, please make sure of the following:
Through this analysis, we believe there is evidence of compelling growth in the casual/family market compared to what we have observed in years past. This is an interesting trend, in our opinion.
Thanks!
Great stuff! I'd love to see this data with the outliers taken out (I imagine Exploding Kittens alone skews the data all by itself). Maybe carve out the projects that do more than $1M into their own category, pulling out the data from the bulk of the projects.
Either way, thanks a lot for all the hard work!
Luke
Thanks, Luke. Again, we did remove outliers for this data. Cheers!
Enable GingerPlaying board/card games seems to be an effective, fun means of delivering medical and safety educations to students and trainees. If you agree and looking for a new unique and strategic card game, check this local inspired fiction game https://lagimcardgame.com and prepare to defend your village.
Cannot connect to Ginger Check your internet connectionor reload the browserDisable in this text fieldEditEdit in GingerEdit in Ginger×